WTI Price Analysis: 50-day SMA guards immediate upside
- WTI stays above 50% Fibonacci retracement following its bounce off 200-day SMA.
- 61.8% and 38.2% Fibonacci retracements could entertain traders during either side break of the short-term key levels.
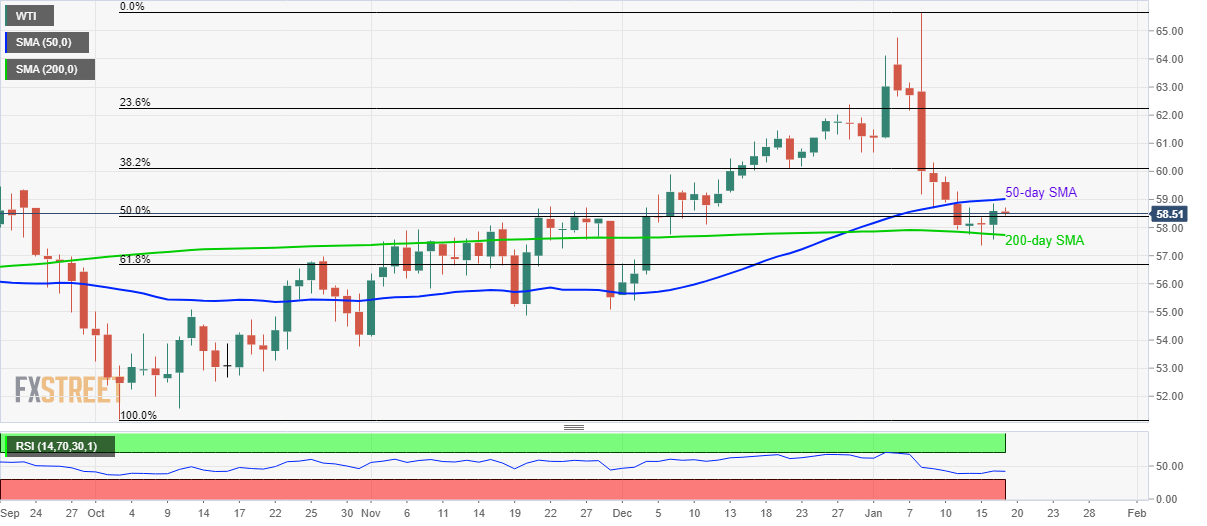
WTI trades around $58.50 during the early Friday. In doing so, the oil benchmark fails to cross 50-day SMA despite taking a U-turn from 200-day SMA, also trading successfully beyond 50% Fibonacci retracement of the October-January upside.
Hence, traders will keep eyes on the black gold’s momentum either during its rise beyond a 50-day SMA level of $59.00 or on the downside break of 200-day SMA surrounding $57.70.
The 61.8% and 38.2% Fibonacci retracements, around $56.65 and $60.10 will be on the traders’ radar during the breaks.
If at all prices manage to remain strong beyond $60.10, the return of $62.50 can’t be denied.
On the flip side, oil price declines below $56.65 can fetch the quote to November 2019 bottom surrounding $54.90.
WTI daily chart

Trend: Sideways
